Every April, Stanford HAI’s AI Index arrives as the closest thing our field has to an annual physical examination. The 2026 edition – the ninth – runs to nearly 400 pages across nine chapters, with new standalone chapters on science and medicine. But you can compress its entire diagnosis into a single line from the co-chairs, Yolanda Gil and Raymond Perrault: this is a field that is “scaling faster than the systems around it can adapt.”
Regular readers will recognise that sentence. It is the empirical restatement of the thesis I have been prosecuting across this blog for two years – in Governing the Ungovernable, in The Adolescence of AI, in The AI Safety Stack, and most recently in From Prompts to Loops and From Risk Minimisation to Dynamic Management. We are deploying 24th-century technology into 20th-century governance structures, and the gap between the two is no longer a rhetorical device. It is now measurable. The AI Index has measured it.
Let me walk you through what the data actually says – and what it demands of those of us building, buying, and governing these systems across Asia Pacific and beyond.
- The Adoption Shock: Faster Than the PC, Faster Than the Internet
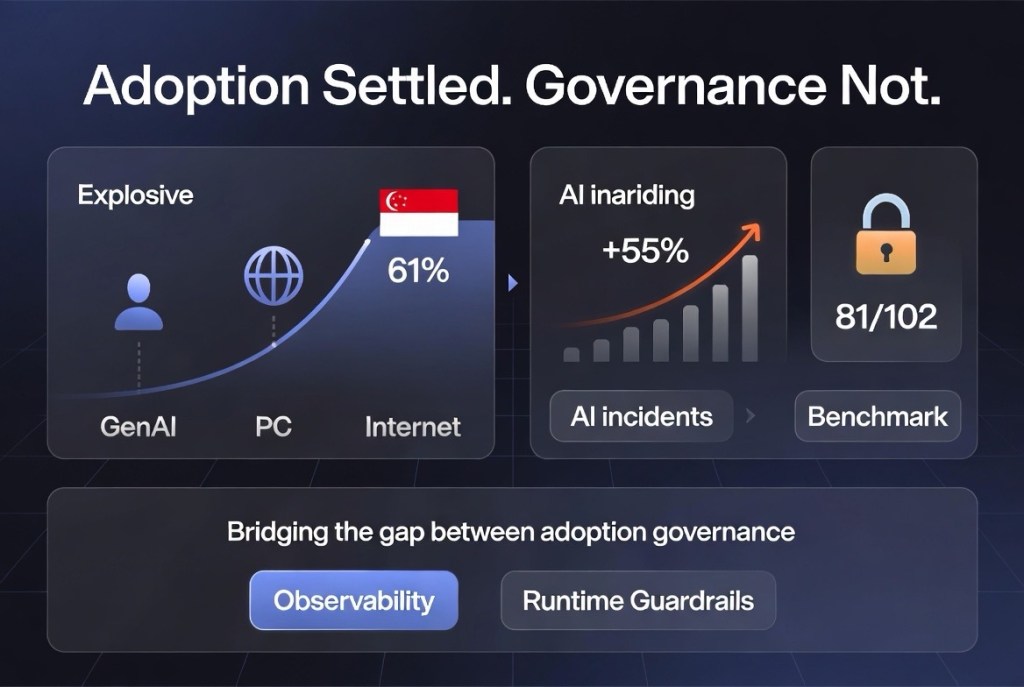
Start with the headline that should reframe every board conversation: generative AI reached roughly 53% population-level adoption within three years of ChatGPT’s launch — a diffusion curve steeper than the personal computer or the internet. Organisational adoption now sits at 88%. Four in five university students use generative AI for their studies. Leading AI companies are reaching meaningful revenue scale in a fraction of the time previous technology generations required, and global corporate investment more than doubled in 2025.
Two details in the adoption data matter enormously for those of us operating in this region. First, adoption correlates strongly with GDP per capita – but Singapore over-indexes dramatically, at 61% population adoption, among the highest in the world. The United States, by contrast, ranks 24th at around 28%. Second, the estimated consumer value of generative AI tools in the US alone reached $172 billion annually by early 2026, with median value per user tripling in a single year – value largely delivered through tools people access for free.
The implication: the adoption question is settled. The governance question is not. And that asymmetry – near-universal deployment atop immature assurance – is precisely the condition I described in Building an AI Governance Framework for the Agentic Era. The technology has arrived; the operating model has not. - The Jagged Frontier: Why Loops Change Everything
The Index gives a name to something every practitioner has experienced: the jagged frontier. Gemini Deep Think earned a gold medal at the International Mathematical Olympiad. The same class of frontier models reads an analogue clock correctly barely half the time – 50.1%, a coin flip. Models exceed human baselines on PhD-level science questions and competition mathematics, while robots succeed at just 12% of household tasks.
Most consequentially for enterprise leaders: AI agents leapt from 12% to roughly 66% task success on OSWorld, the benchmark testing real computer use across operating systems. That is a five-fold improvement in a year – extraordinary. It also means agents still fail roughly one in three attempts on structured tasks.
Hold those two numbers together. A 66% success rate is transformative for a copilot and catastrophic for an unsupervised actor. This is the entire argument of From Prompts to Loops rendered in benchmark data. When AI was a prompt-response system, a failure was a bad answer – annoying, contained, human-reviewed by default. When AI is an agentic loop – perceiving, planning, invoking tools through MCP, delegating to other agents through A2A, writing to memory, acting again — - – a failure compounds. Goal hijacking, memory poisoning, tool misuse and rogue-agent drift (the OWASP Agentic Top 10 canon) are not theoretical at a 33% failure rate. They are Tuesday.
The frontier is jagged; therefore governance must be continuous and runtime-aware, not periodic and paper-based. You cannot certify a jagged system once and walk away. You must observe the loop.
- The Governance Deficit, Now Quantified
Chapter 3 of the Index delivers the numbers behind what I have called the governance deficit:
• Documented AI incidents rose to 362 in 2025, up from 233 in 2024 — - – a 55% year-on-year increase, and that is only what gets documented.
• Nearly all frontier developers report capability benchmark results; reporting on responsible AI benchmarks remains spotty and inconsistent.
• New research finds that improving one responsible AI dimension (say, safety) can actively degrade another (say, accuracy) – trade-offs, not free lunches.
• Benchmarks are saturating, frontier labs are disclosing less, and independent testing does not always confirm what developers report.
That last point deserves dwelling on. The transparency data in Chapter 1 is stark: of 102 notable models released in 2025, 81 shipped without training code. Parameter counts, dataset sizes and training duration are no longer disclosed for the most resource-intensive systems from the leading labs. The most capable models are now the least transparent – which, as the Index notes, limits external researchers’ ability to reproduce results, audit development, and validate safety claims.
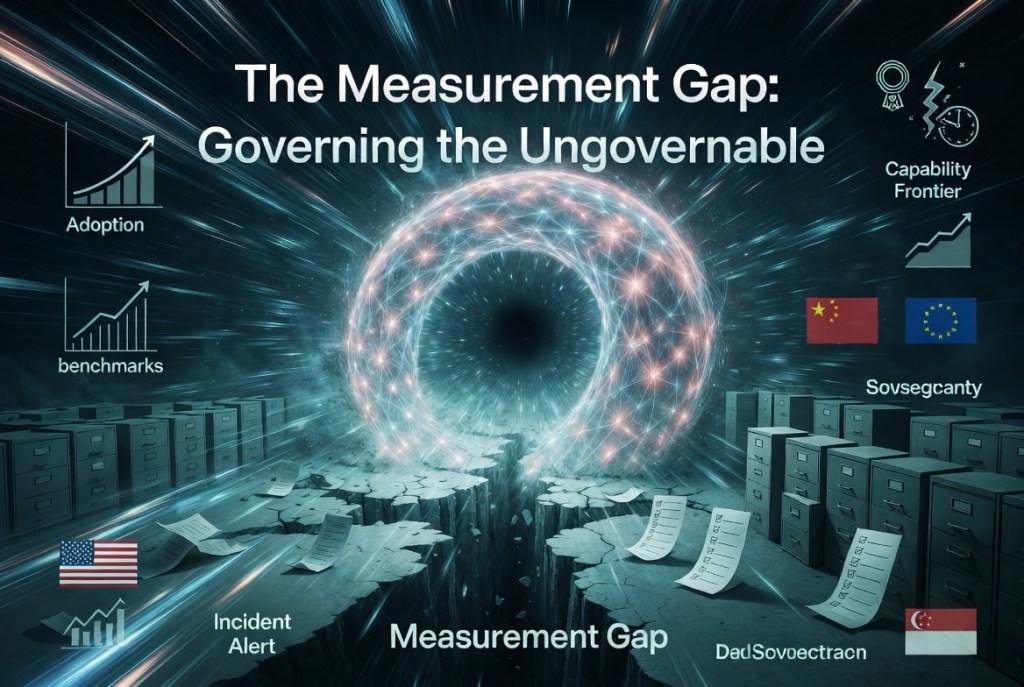
So assemble the picture: capability accelerating, incidents rising 55%, safety reporting voluntary and patchy, evaluation instruments saturating, and the frontier going dark. This is the measurement gap – and it is why enterprise governance can no longer outsource assurance to lab self-reporting or static certification. If the labs will not show you the loop, you must instrument it yourself: unalterable observability logs, intent-versus-action auditing, runtime guardrails, continuous evaluation against your risk appetite rather than a saturated public benchmark. Governance without security is fragile; security without governance is blind. The 2026 data makes the unified cockpit non-negotiable. - Convergence, Sovereignty, and the Regulatory Fork
Geopolitically, the Index confirms a structural shift: the US–China model performance gap has effectively closed. The two have traded the lead multiple times since DeepSeek-R1 briefly drew level in February 2025; as of March 2026, the leading US model holds an advantage of just 2.7%. Open-weight models are more competitive than ever. The US still produces more top-tier models (59 notable releases to China’s 35 in 2025) and higher-impact patents; China leads in publication volume, citations, patent grants and industrial robot installations. South Korea, notably, leads the world in AI patents per capita.
Meanwhile, governments acted decisively in 2025 – but in opposite directions. The EU AI Act’s first prohibitions took effect. The United States shifted towards deregulation. Japan, South Korea and Italy passed national AI laws. More than half of newly adopted national AI strategies came from developing countries entering the policy arena for the first time. And across all of it, AI sovereignty emerged as the organising principle — - – sovereign compute, sovereign models, sovereign data.
Add the physical layer and sovereignty becomes visceral: the US hosts 5,427 data centres, more than ten times any other country, while a single Taiwanese foundry ; TSMC – fabricates virtually every leading AI chip on Earth. The entire global AI hardware stack rests on one point of dependency in one strait.
For regulated enterprises in Asia Pacific, the practical consequence is the one I outlined in the 2026 Field Guide: regulatory fragmentation is now a permanent operating condition, not a transitional phase. A bank operating across Singapore, the EU and the US faces MAS FEAT and AIRG, the EU AI Act, and a deregulating American landscape simultaneously — - – with sovereignty requirements layered on top. The only rational response is a governance architecture built for interoperability: a control plane mapped once to MAS AIRG, EU AI Act, NIST AI RMF, ISO 42001 and the OWASP Agentic Top 10, so that compliance becomes a configuration exercise rather than a per-jurisdiction rebuild. This is the design philosophy behind TrustOS, and the Index’s sovereignty chapter reads like its business case.
- The Bill Comes Due: Energy, Water, Carbon
The Index also quantifies the physical externalities we can no longer footnote. AI data centre power capacity reached 29.6 GW — comparable to the entire state of New York at peak demand. Training Grok 4 produced an estimated 72,816 tonnes of CO₂ equivalent, against roughly 63 tonnes for the lifetime of an average car. Annual inference water consumption for a single model family may exceed the drinking-water needs of 1.2 million people.
There is a counter-signal worth celebrating: efficiency is improving. DeepSeek-V3 trained at a fraction of the emissions of comparably sized peers, and Ai2’s Olmo 3.1 Think 32B — nearly ninety times smaller than Grok 4 — achieves comparable results on several reasoning benchmarks through data curation, pruning and deduplication rather than brute scale. Quality is beginning to substitute for quantity. But the aggregate footprint is growing regardless, and boards should expect environmental disclosure to migrate from ESG appendix to AI governance core. The trust stack now extends all the way down to the power grid and the water table. - Turbulence in the Labour Market — Arriving Exactly Where Predicted
Here is the finding that connects the Index to From Builders to Orchestrators, published on this blog just this week: measured productivity gains of 14–26% are appearing in customer support and software development — and in software development, employment for US developers aged 22 to 25 fell nearly 20% from 2024, even as headcount for older developers continued to grow.
Read that again. The productivity gains and the entry-level employment decline are appearing in the same fields. The rungs at the bottom of the ladder are being removed first — precisely the “AI Atlantis” dynamic I have written about, and precisely why the builder-to-orchestrator transition is not optional career advice but structural necessity. Meanwhile, agent deployment remains in single digits across nearly all business functions: the turbulence so far reflects copilots, not yet autonomous agents. The wave behind this wave is larger.
This is the short-term turbulence, arriving on schedule. Whether it resolves into long-term abundance depends on choices being made now — in reskilling, in organisational design, and in governance. - Trust: The 50-Point Chasm
Finally, the human experience layer — because HX remains the point of all of this. The Index finds a 50-point gap between experts and the public on whether AI will improve how people do their jobs: 73% of experts expect a positive impact; just 23% of the public agrees. Global optimism rose in 2025 — and so did nervousness. Among surveyed countries, Americans reported the lowest trust in their own government to regulate AI, at 31%, and globally the EU is trusted more than either the US or China to regulate effectively.
Trust, as this blog’s masthead has said from the beginning, is the only currency of the experience economy — and of the age of intelligence. A 50-point perception gap between the people building this technology and the people living inside it is not a communications problem. It is a governance problem. Trust is not restored by reassurance; it is restored by verifiable systems — explainable decisions, auditable loops, demonstrable accountability. Trust by design, not trust by press release.
The Synthesis: From Measurement Gap to Operationalised Governance
Put the nine chapters together and the 2026 AI Index describes a single system under strain:
Capability is compounding (jagged, but compounding). Adoption is universal (faster than any prior technology). Incidents are rising (up 55%). Transparency is falling (81 of 102 models closed). Evaluation is breaking (benchmarks saturated, claims unverified). Regulation is fragmenting (sovereignty everywhere, alignment nowhere). Labour is turbulent (entry-level first). Trust is fractured (a 50-point chasm).
Every one of those vectors points to the same conclusion, the one I delivered at IMAS in April: no governance means you stay stuck in pilots; operationalised AI governance is what unlocks autonomy at scale. The organisations that treat governance as a brake will be lapped by those who understand it as the steering, suspension and telemetry that let you take the corner at speed. Dynamic risk management, not risk minimisation. Runtime observability, not annual attestation. A unified cockpit spanning discovery, assessment, governance, security and audit — because the loop does not pause for your quarterly review.
The Index’s co-chairs are right: the field is scaling faster than the systems around it can adapt. But “the systems around it” are not fixed. They are ours to build. That is the work — and the ninth AI Index, for all its sobering data, is ultimately a 400-page argument that the work is both urgent and tractable.
The Fork remains before us: Star Trek or Mad Max, abundance or scarcity. The 2026 data does not choose for us. It simply shows us, with unprecedented clarity, how little time we have to choose well.
Short-term turbulence, long-term abundance.
— Luke
Source: Stanford HAI, “The AI Index 2026 Annual Report,” AI Index Steering Committee, Institute for Human-Centered AI, Stanford University, April 2026. Related reading on this blog: “From Prompts to Loops: Securing and Governing Agentic AI”; “From Risk Minimisation to Dynamic Management”; “Building an AI Governance Framework for the Agentic Era: A 2026 Field Guide”; “From Builders to Orchestrators”; “Governing the Ungovernable”; “The Adolescence of AI”; “The AI Safety Stack”.

Leave a comment